This is Pleasanton, California as one continuous isometric drawing, about 8,500 tiles of it.
A model drew every tile from a 3D view of the real place. Most of the work was making the tiles join, and
catching the model when it drew something that is not there.
The map has been drawn twice, in two different ways. Both are on the site: use the selector at the bottom
of the map to switch.
v1v2
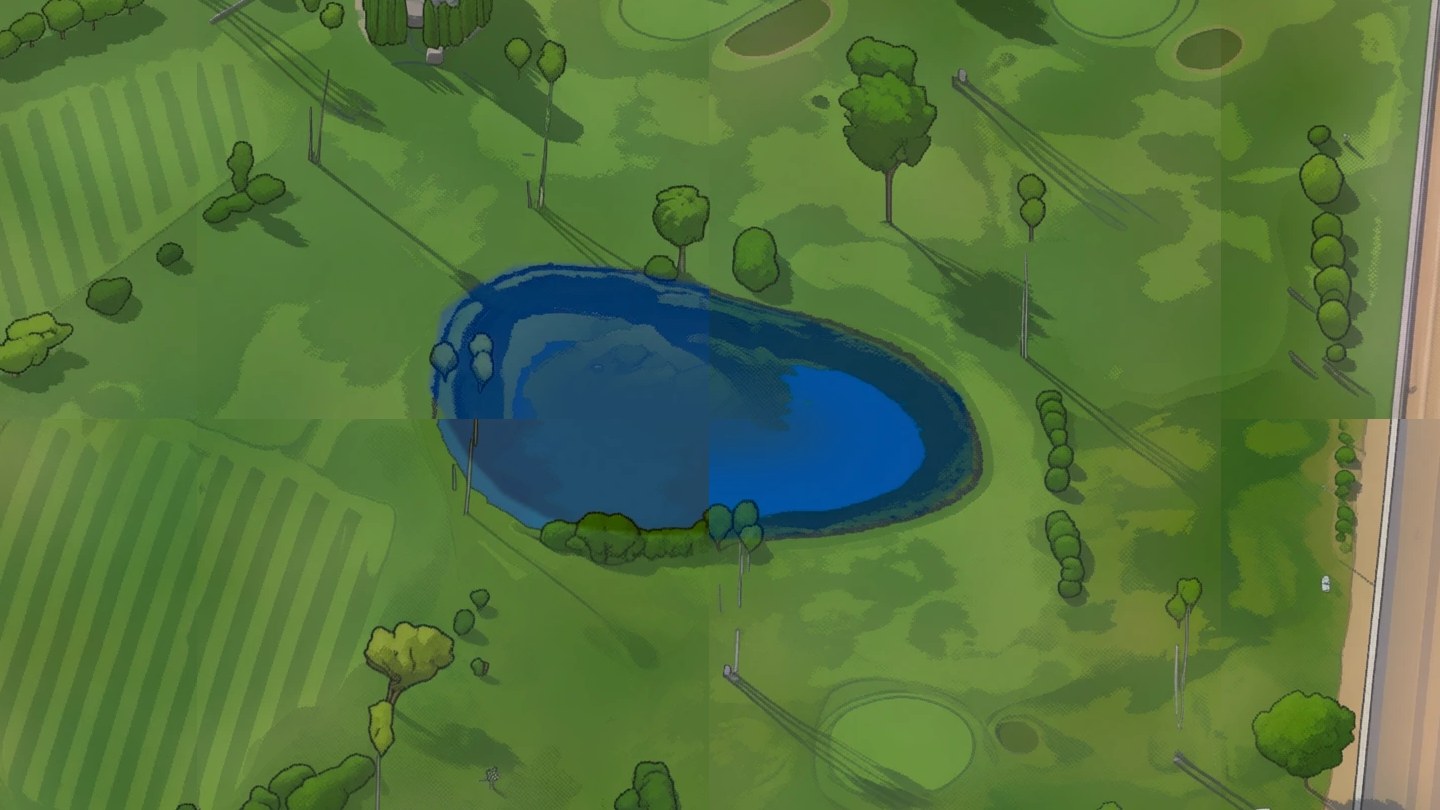
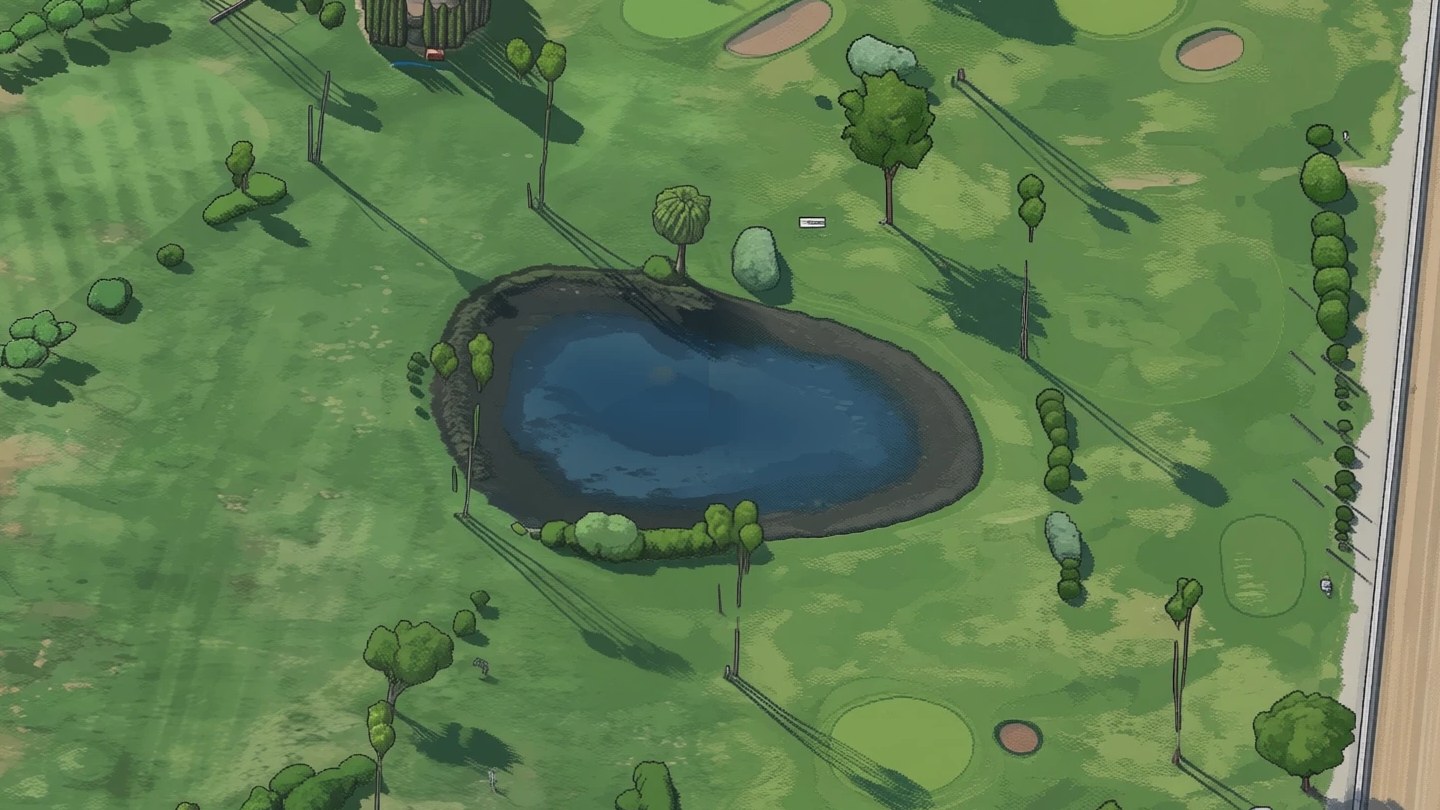
The pond inside the fairgrounds racetrack, drawn both ways. Drag the divider. In v1 four separately
drawn windows meet in the water and each chose its own blue. In v2 the whole neighbourhood was drawn at once.
From a 3D model to a drawing
Render. Every 130 m block of the city, 2,353 of them, was rendered from Google's photorealistic
3D tiles with one fixed camera: looking southeast, 30 degrees down. The renders are only an input and are
never published.
Make examples. An image model redrew 100 sample blocks in one illustration style. Each result
was checked by hand against its render, and 238 were kept as training pairs.
Teach the style. A LoRA, a small add-on trained for about two hours on those pairs, makes the open
image-editing model Qwen-Image-Edit redraw any block in that style while keeping every street, building
and tree where it is.
Draw the city. The model draws one block-sized window at a time, and a city is thousands of
windows. The two versions differ in how the windows are made to join. That is the next section.
Check against the real thing. Every tile is compared with its render. Where the drawing does not
follow the render, the tile is redrawn or held back.
Publish. The tiles are stacked into nine zoom levels and served as plain files. The land around
the city is public aerial imagery, tilted to the same camera and covered in mist.
Two ways to draw a city
A window on its own comes out well. The hard part is the edge between two windows: left alone, each one
picks its own shade of grass, its own blue for water, even its own idea of whether a track is sand or
asphalt.
v1Window by window
Six tiles in a row. The edge in the middle was seen by neither of the two later windows.
Each window is drawn next to finished neighbours. The model is shown the art that already exists on
some sides and fills in the rest, so roads and roofs carry on across the edge.
To finish in hours instead of days, windows that do not overlap are drawn at the same time on several
GPUs. That is where it breaks: two windows drawn at the same time can share an edge that neither of
them saw. On even ground such as a golf course, the map shows squares.
The repair came afterwards. Every tile's colours were pulled toward what its render implies, which
evens out the tone. It cannot make two windows agree on what a surface is.
v2Drawn together
Solid: the windows of one step. Dashed: where they sit on the next step. The green strip is a
finished neighbour, held in place.
The model does not draw in one go. It starts from noise and refines the picture over 16 steps. v2
treats a whole neighbourhood, about a kilometre across, as one picture. At every step the model looks
through many overlapping windows, the predictions are averaged where windows overlap, and the next step
starts from that shared result.
No window ever finishes on its own, so there is no edge to hide. On every other step the windows
move over by half their spacing, so no spot always sits at the rim of a window.
Neighbourhoods are drawn in four rounds. A later one begins with a strip of its finished neighbours
held in place, so it grows out of them. The model and the style add-on are the same as in v1: nothing
was retrained.
v1v2
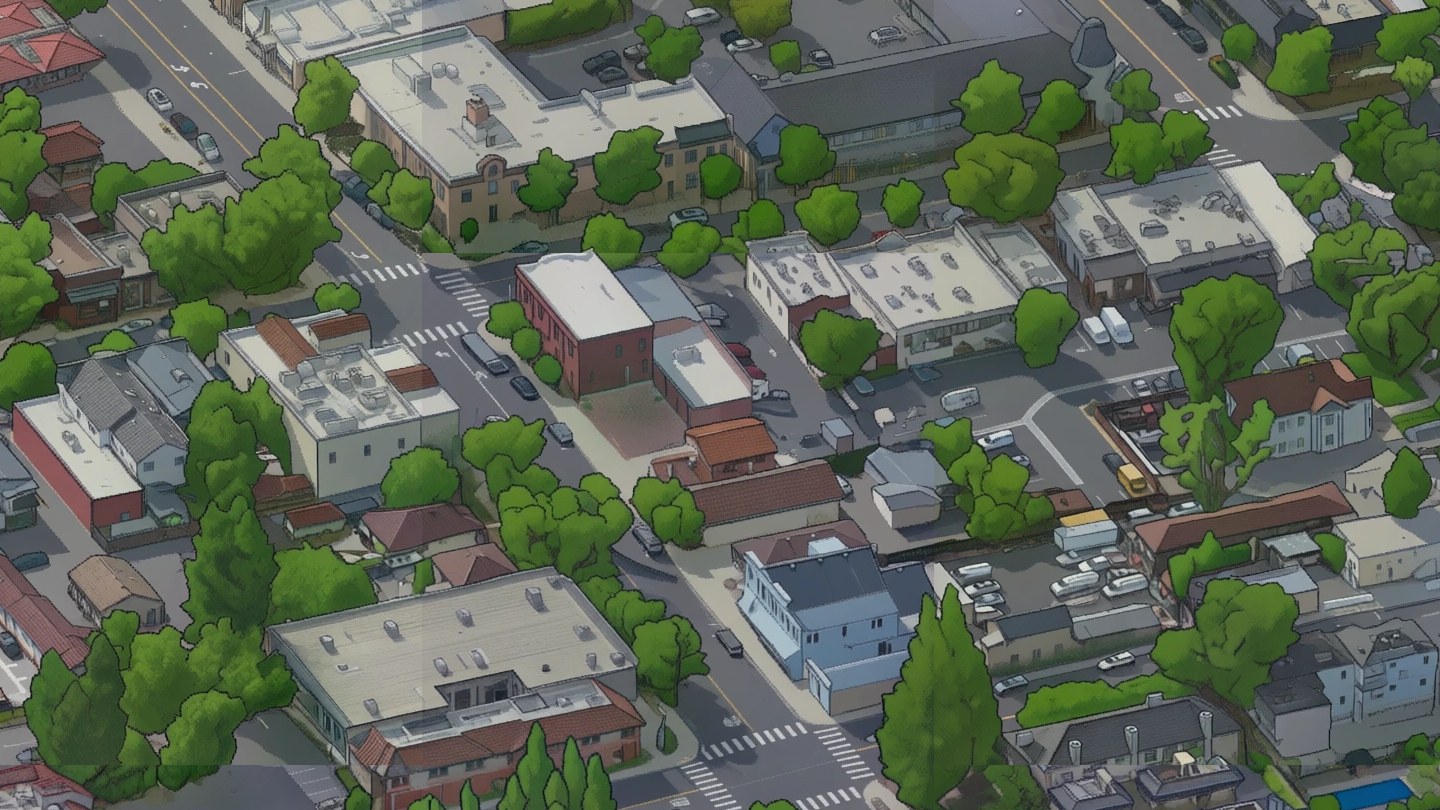
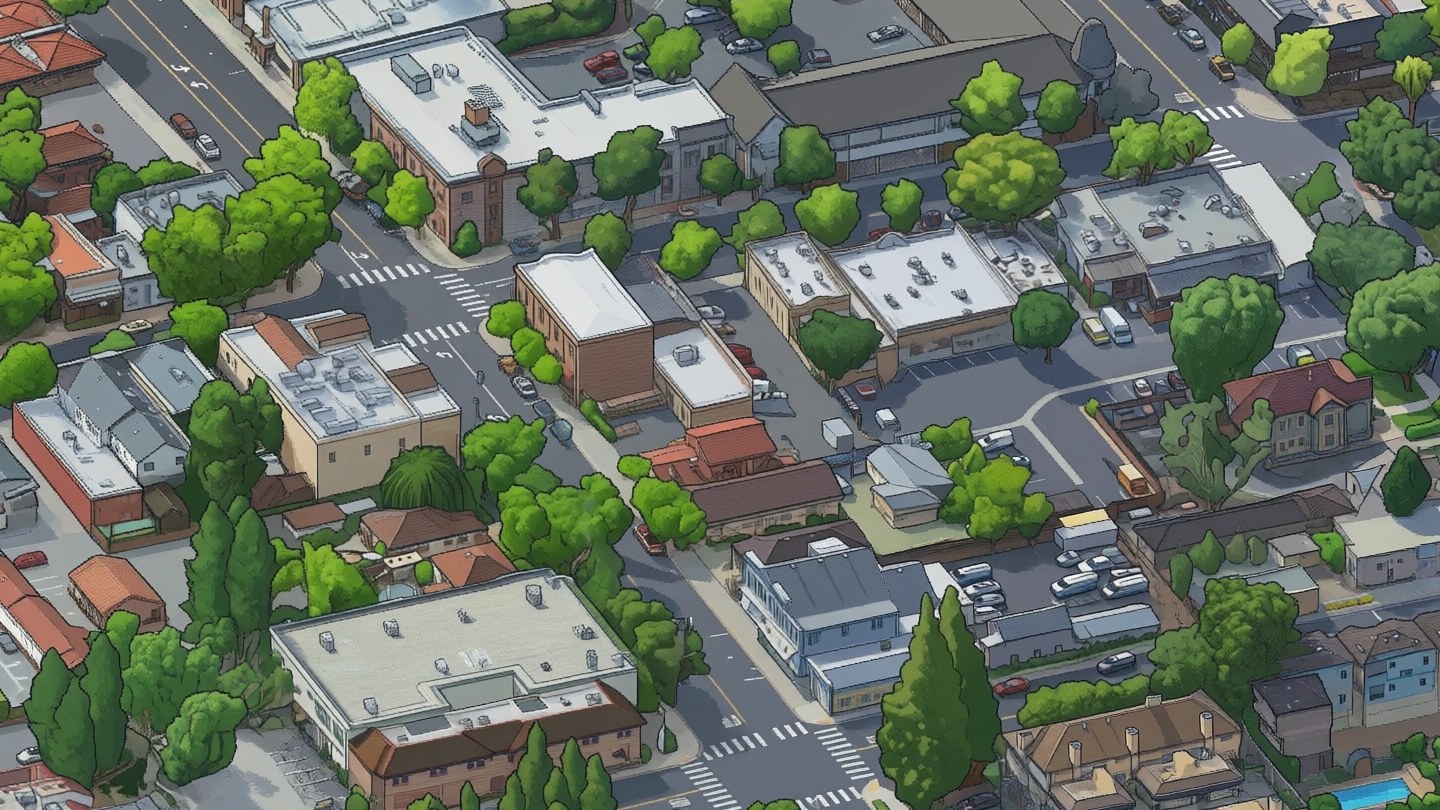
Downtown. Drawing a neighbourhood at once also kept more of what is really there: brick fronts,
roof equipment, the shapes of individual trees.
Empty ground, and what the model put on it
Drawn together, the neighbourhoods came out better than in v1. Open land did not. Where the 3D view shows
only dry grass, vines or plowed soil, the model has little to hold on to, and it fills the space. The first
pass of v2 drew a subdivision into a vineyard, a small town into a plowed field and compounds onto bare
hills. A check that compares every tile with the 3D view found something that is not there in
429 of the first 5,464 tiles, nearly all of them on open land. That pass was
stopped two thirds of the way through.
first passv2
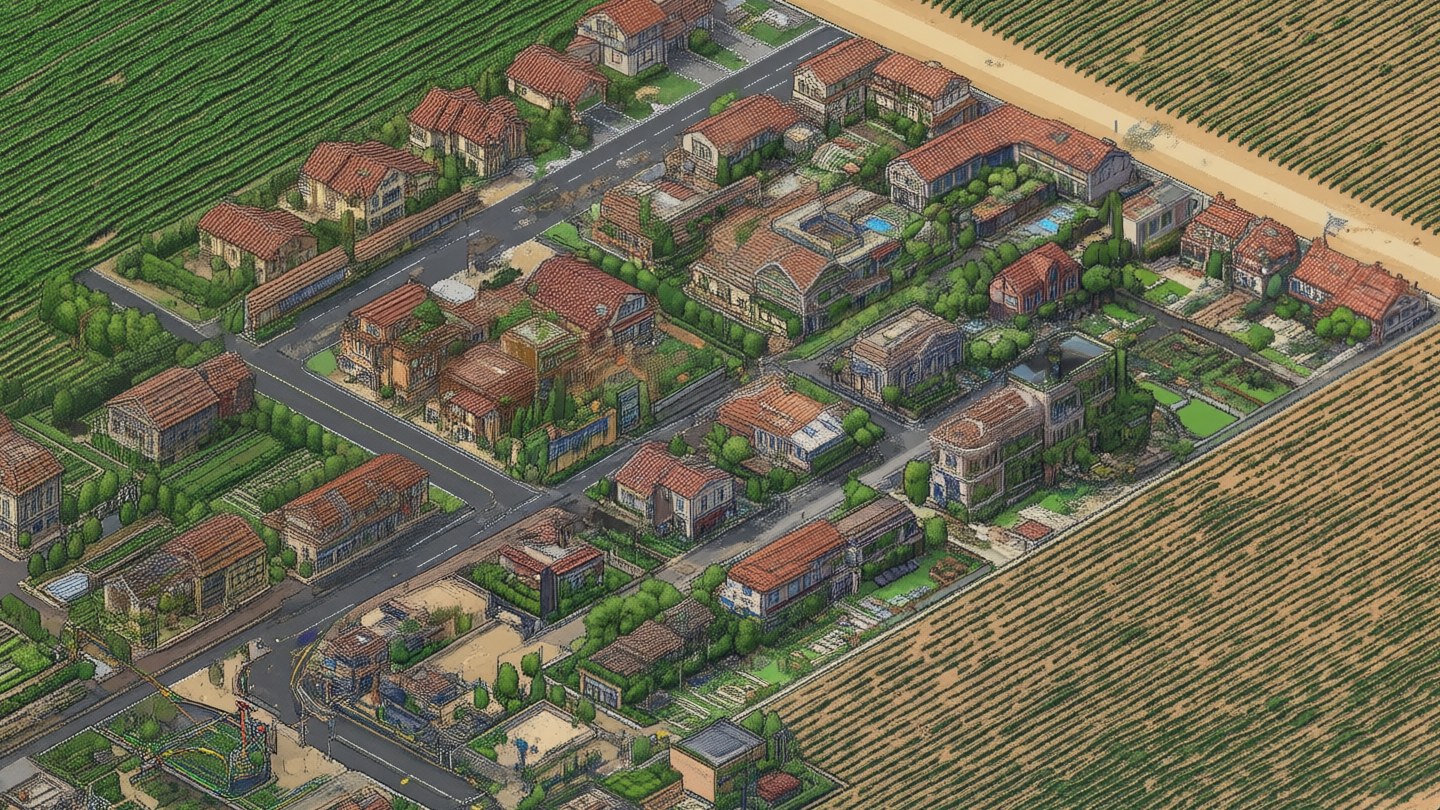
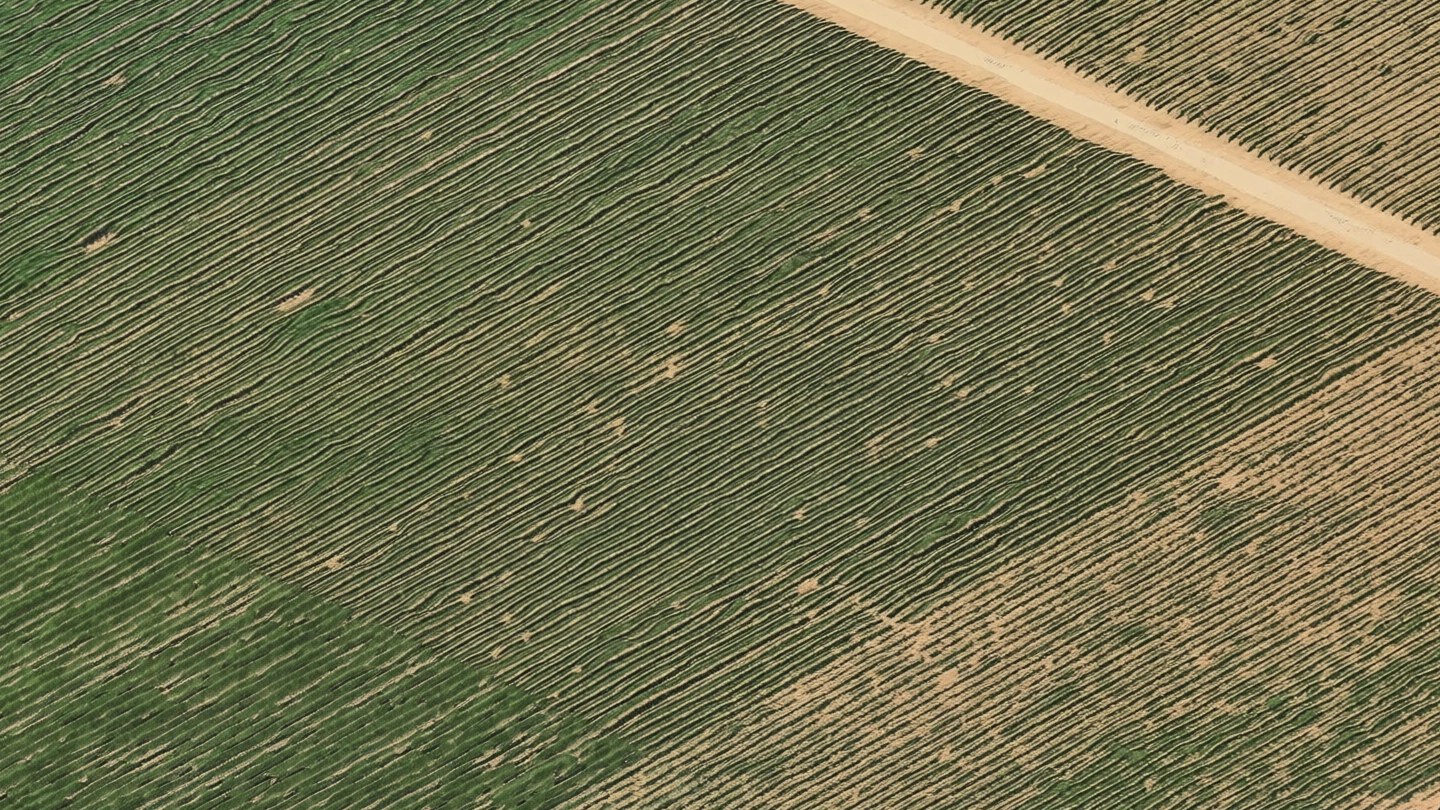
A vineyard on the east side of town. The first pass started from noise and drew houses that do not
exist. The published v2 starts open land from the broad shapes of the 3D view.
Asking again with a different random start does not help: the model invents
something else. What helps is not starting from nothing. On open land, for the first six of its sixteen
steps, v2 pulls the broad shapes and colours of the picture toward the 3D view of the place. Only shapes
wider than a house are held. Everything finer is left to the model, so the lines are still its own. After
the sixth step it is let go and finishes the drawing by itself.
The sixteen steps of one drawing. Filled: open land is held to the broad shapes of the 3D
view. Empty: the model draws alone.
Three simpler ideas failed first, and each failure said something about the model. Given a blurred picture
of the ground to start from, it handed back the blur. Given the sharp 3D view, it returned a lightly
painted photo: correct, and no longer a drawing. Holding only the broad shapes kept both the place and the
drawing.
Neighbourhoods still start from noise, because that is where the model draws its crispest lines and
because it does not invent where there is a street to follow. Open land is
36% of the map.
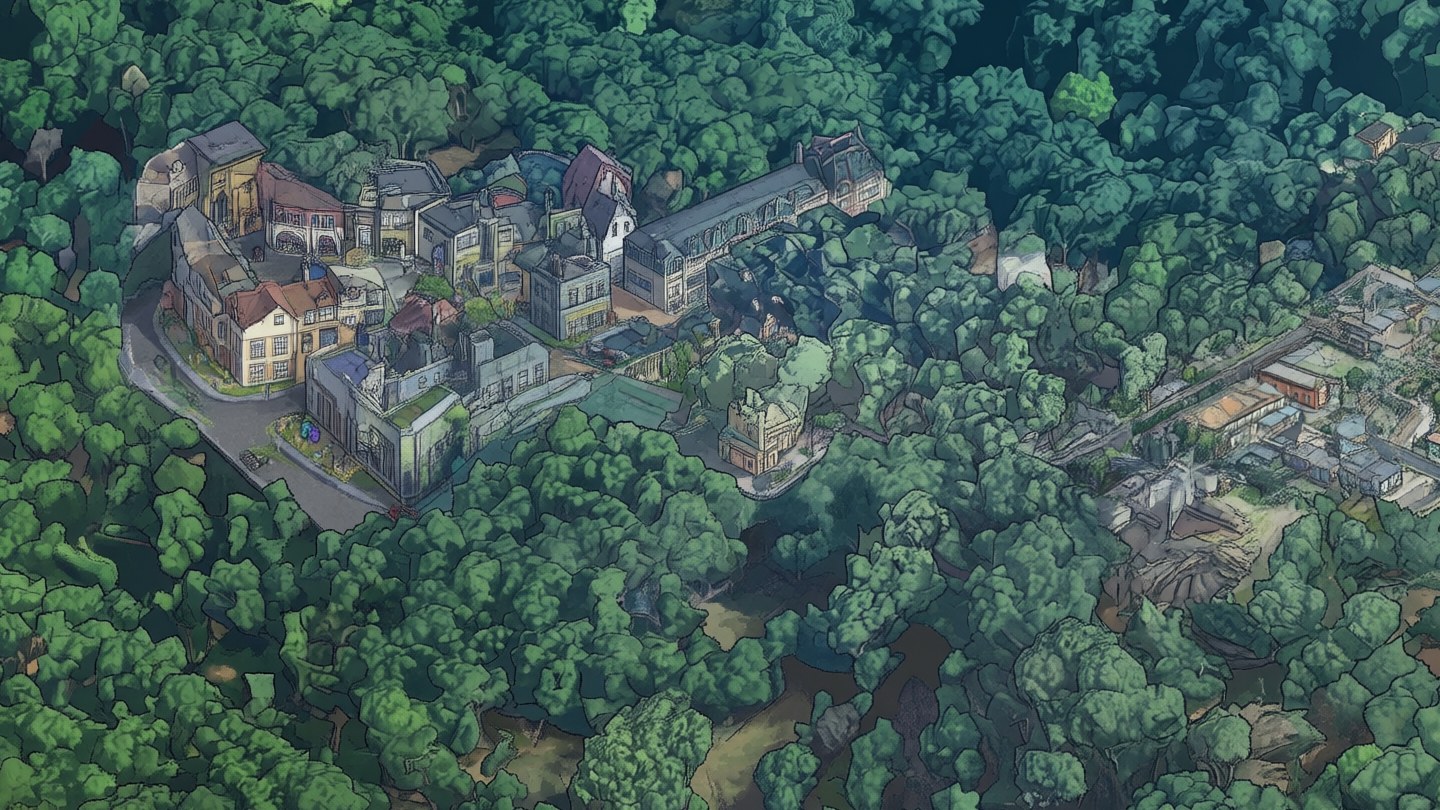
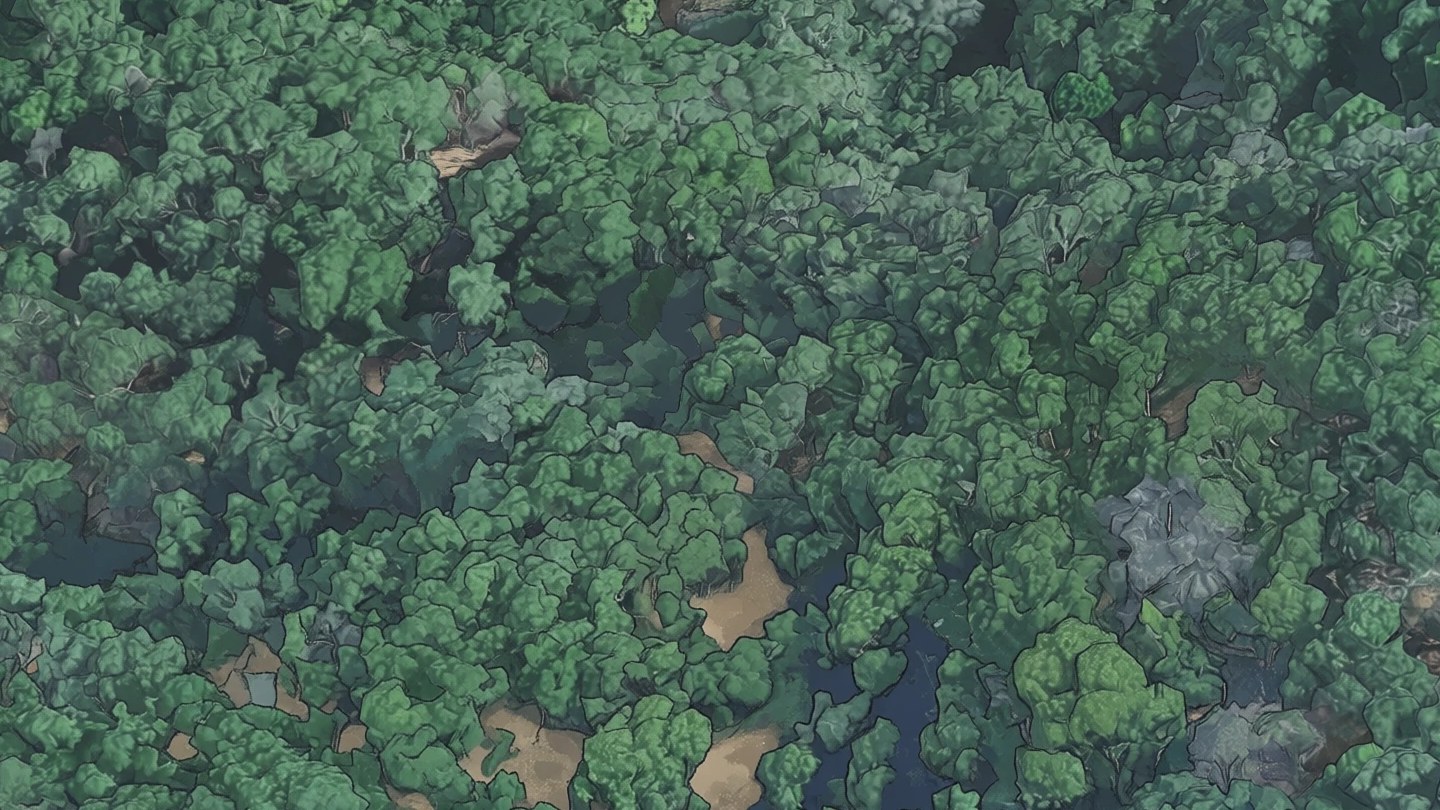
The rule that says what is open land was wrong once. The oak woods on the hills west of town photograph
blue, the rule took blue-green for built-up ground, and 597 tiles of forest were drawn from noise. The
model put a manor, a church and a small subdivision under the trees. Drawn again with the pull, the
forest is a forest.
from noisev2
Oak woods west of town. Taken for built-up ground, they were drawn from noise and filled with
buildings. With the pull they are trees again.
The two runs in numbers
v1
v2
Drawn in one piece
one window, 130 m across
one neighbourhood, about 1 km across
Pieces
4,176 windows
53 neighbourhoods
GPU time
13 hours
20 hours
On three rented GPUs
4.5 hours, $43
8.5 hours, $78
Tiles drawn again after the checks
18
776
Tile edges with a visible step, fairgrounds area
73%
1%
Starts from
noise, beside finished neighbours
noise in neighbourhoods, the 3D view's broad shapes on open land
Tiles the edge check flags
51 of 8,471
22 of 8,474
Passes thrown away
none
one, stopped at two thirds ($36)
What the model got wrong
It invents on empty ground. In v1 it drew a mansion on a lake island, a lighthouse on a quarry
shore and small villages on hillsides. Drawn together and started from noise, it invented several times as
often. The check that catches this looks for two things the 3D view does not have at that spot: hard edges,
and the greys and reds of roofs and paving where the view is green or tan. Only the edge test works on
v1, whose tints confuse the colour test; by that test alone v1 has 51 flagged tiles, the first pass of v2
had 100 in two thirds of the map, and v2 as published has 22, each of them a real thing on the ground.
The check is not the last word. Most of what it flags is a parking lot, a rail line
or a riding arena, and it cannot see into shade: shade is grey, and so is a roof. So every tile of open
land under trees or in shadow, about a tenth of the map, was compared with the 3D view by eye, tile by
tile. Two faults came out. One was the oak woods above: 597 tiles drawn from noise by mistake, and drawn
again with the pull. The other is that on dark ground the pull is too loose. It still let through a cabin
in a grove, a shaded driveway drawn as a stream and, on a lake shore, three houses. Those
tiles, 272 of them, were drawn once more with the whole 3D view held for the first six steps, not
only its broad shapes. They are true to the place and a little softer than their neighbours. In
neighbourhoods, which still start from noise, small liberties remain: a pool in a yard that has
none.
The map data was wrong, and the pipeline believed it. Lakes get one flat blue, taken from the
water outlines in OpenStreetMap, because the model invents on open water. A flood basin, two concrete
basins, a quarry pit and a gravel wash are water in that data and were dry when the photo was taken, so
v2 first drew ponds in them. On those tiles the photo now decides what is water.
Started from the photo, it draws less. On open land v2 is closer to the 3D view than to a
drawing: the ground keeps the texture of the photo, and only trees and buildings get the model's outlines.
That was the price of an honest hillside.
It tints. In v1 some forest windows came out blue-green and each lake had its own blue. The colour
repair fixed the tone, but not the squares.
It simplifies thin things. Tall, thin trees sometimes become a crown with no trunk. Both
versions do this.
Built with
Qwen-Image-Edit with a LoRA trained for this map, run with diffusers on rented GPUs.
Python for everything else: the renderer, the planner that splits the map among GPUs, the checks, the
tile pyramid.
Leaflet for the viewer. The site is static files.
Credits
Source imagery: Google Maps Platform, Photorealistic 3D Tiles.
Surroundings: USGS and USDA, NAIP orthoimagery (The National Map).
Water, places and search: OpenStreetMap contributors (license), search by Nominatim.
Averaging overlapping windows follows MultiDiffusion (Bar-Tal and others, 2023). Holding finished areas
in place follows RePaint (Lugmayr and others, 2022). Pulling the early steps toward the broad shapes of a
reference follows ILVR (Choi and others, 2021).
Inspired by Isometric NYC, Isopolis, tiny.london and Pixel Singapore.